1. CloudWatch Logs
CloudWatch Logs is a centralized log management service. It collects, stores, monitors, and analyzes log data from AWS services, applications, and on-premises servers.
Core Concept
CloudWatch Logs = centralized log management. Send logs from any source (EC2, Lambda, ECS, API Gateway, VPC Flow Logs, Route 53, on-premises) to CloudWatch Logs. Search, filter, set alarms based on log patterns, and export for analysis.
Log Structure
.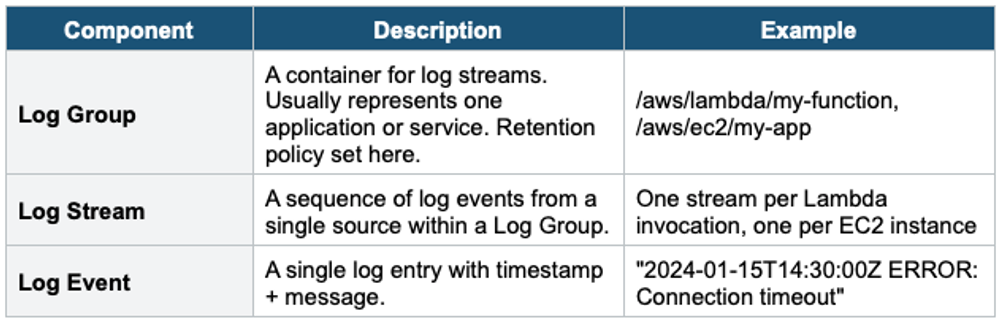
Log Sources
- Lambda: automatic (logs sent to /aws/lambda/<function-name>)
- EC2: CloudWatch Agent (must install and configure)
- ECS/Fargate: awslogs log driver
- API Gateway: access logs and execution logs
- VPC Flow Logs: network traffic metadata
- Route 53: DNS query logs
- CloudTrail: API call logs (deliver to CW Logs for real-time monitoring)
- RDS / Aurora: database engine logs (error, slow query, audit)
- On-premises: CloudWatch Agent or CW Logs API
Retention
- Default: never expire (stored indefinitely)
- Configurable: 1 day to 10 years, or indefinite
- Set retention per Log Group
- Storage cost: ~$0.03/GB/month (ingest) + ~$0.03/GB/month (stored)
2. Metric Filters
Metric Filters extract metric data from log events by matching specific patterns, turning log data into CloudWatch metrics.
Metric Filter Example:

Log Group: /aws/lambda/my-api
Filter Pattern: "ERROR"

Every log line containing "ERROR" increments a custom metric.

Metric: ErrorCount (namespace: MyApp)
Alarm: If ErrorCount > 10 in 5 minutes → SNS alert

Advanced patterns:
  { $.statusCode = 500 }   → Match JSON field
[ip, user, timestamp, request, status_code = 5*] → Space-delimited- Metric Filters do NOT retroactively scan existing logs (only new events)
- Can extract values from JSON logs: { $.latency > 1000 }
- Create CloudWatch Alarms on the resulting metric
3. CloudWatch Logs Insights
Logs Insights is a purpose-built query language for searching and analyzing log data interactively.
Key Features
- Query log data using a SQL-like syntax
- Auto-discovers fields in JSON logs
- Visualize results as: time-series charts, bar charts, tables
- Query across multiple Log Groups simultaneously
- Saved queries for reuse
- Pay per query: $0.005 per GB of data scanned
Query Syntax Examples
# Find the 20 most recent errors
fields @timestamp, @message
| filter @message like /ERROR/
| sort @timestamp desc
| limit 20

# Top 10 most expensive Lambda invocations
fields @timestamp, @duration, @memorySize
| filter @type = "REPORT"
| sort @duration desc
| limit 10

# Count errors per hour
fields @timestamp, @message
| filter @message like /ERROR/
| stats count(*) as errorCount by bin(1h)

# Average API latency by endpoint
fields @timestamp, endpoint, latency
| stats avg(latency) as avgLatency by endpoint
| sort avgLatency desc
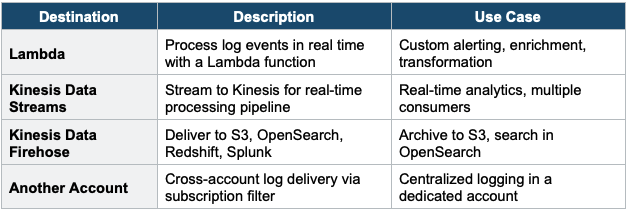
4. Log Subscriptions
Real-time streaming of log events from CloudWatch Logs to other services for processing.
5. Log Export & Cross-Account
S3 Export
- Export log data to S3 for long-term storage and analysis
- CreateExportTask API: batch export (not real-time, takes up to 12 hours)
- For real-time: use Subscription Filter → Firehose → S3
Cross-Account Logging
- Send logs from multiple accounts to a centralized logging account
- Pattern: Source Account → Subscription Filter → Kinesis/Firehose → Destination Account S3
- Use Subscription Filter with cross-account destination
- Centralized logging is a security and compliance best practice
6. CloudWatch Logs Live Tail
- View log events in real time directly in the CloudWatch Console
- No polling or refreshing — events stream as they arrive
- Filter events in real time
- Use for: debugging Lambda, monitoring deployments, watching for errors live
Exam Tip
CloudWatch Logs: "Centralized logs" = CloudWatch Logs. "Extract metrics from logs" = Metric Filters (not retroactive). "Query logs with SQL" = Logs Insights. "Stream logs to S3 in real-time" = Subscription Filter → Firehose. "Batch export logs" = CreateExportTask (slow, up to 12 hours). "EC2 memory/disk in CW" = CW Agent. "Cross-account logging" = Subscription Filters to a centralized account. Retention: default = never expire.