1. What is X-Ray?
AWS X-Ray is a distributed tracing service that helps you analyze and debug distributed applications. It traces requests as they travel through your application’s services, showing the complete request path, latency at each hop, and errors.
Core Concept X-Ray = distributed tracing. When a request flows through API Gateway → Lambda → DynamoDB → SQS → another Lambda, X-Ray traces the ENTIRE path, showing where time is spent and where errors occur. It creates a visual Service Map of your architecture and identifies bottlenecks.
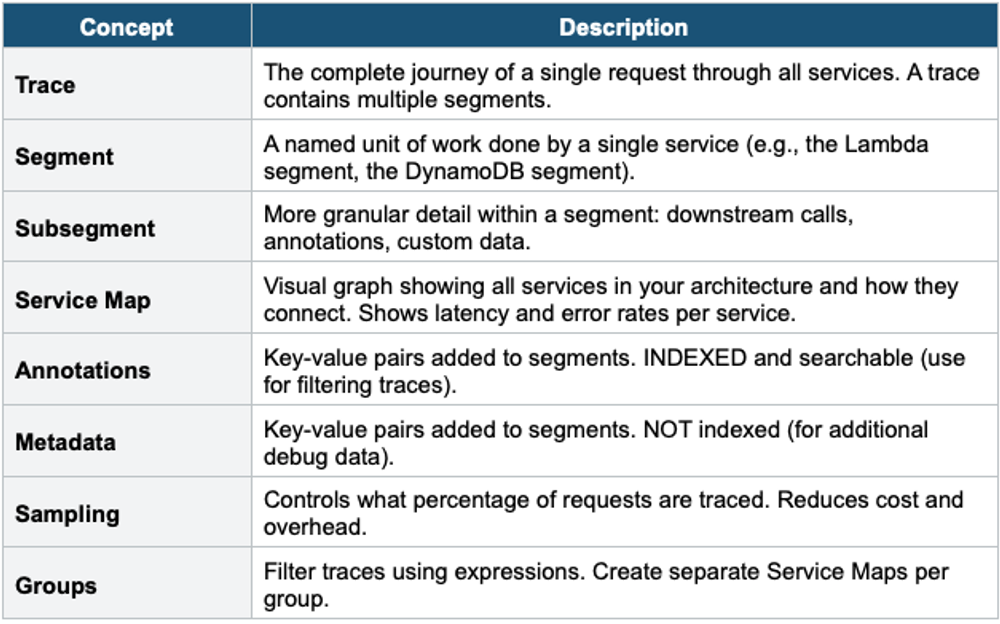
2. Key Concepts
3. How X-Ray Works
X-Ray Tracing Flow:
1. Request enters your application
2. X-Ray SDK (in your code) or AWS service sends trace data to X-Ray Daemon
3. X-Ray Daemon (running on EC2/ECS/Lambda) batches and sends data to X-Ray service
4. X-Ray processes and stores trace data
5. X-Ray Console shows: Service Map, traces, latency distribution, error analysis
Instrumentation Options: - X-Ray SDK: add to your code (manual, most control) - AWS Distro for OpenTelemetry (ADOT): vendor-neutral alternative - Auto-instrumentation: some services trace automatically (Lambda, API GW)
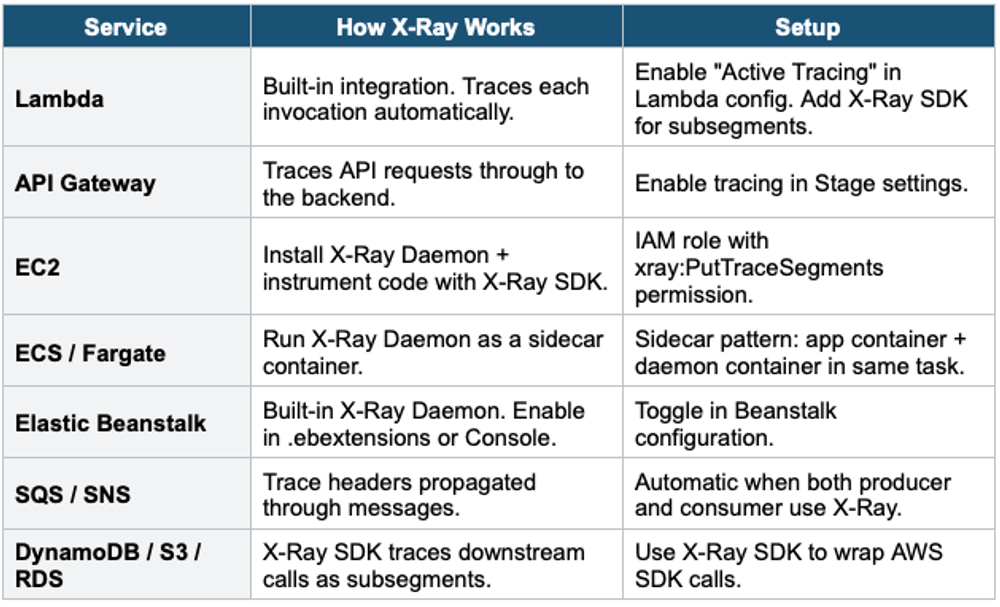
4. X-Ray Integration with AWS Services
5. Sampling Rules
Sampling controls which requests are traced. Without sampling, tracing every request would be expensive and generate too much data.
- Default Sampling Rule: 1 request per second + 5% of additional requests (reservoir + rate).
- Custom Rules: Define rules by: service name, HTTP method, URL path, and host. Example: trace 100% of /checkout requests but only 1% of /health requests.
- Sampling rules can be changed WITHOUT redeploying your application (managed centrally in X-Ray)
6. X-Ray Insights
- Automatically detects anomalies in your application’s performance
- Identifies: latency spikes, error rate increases, fault trends
- Determines root cause: which service/node caused the issue
- Sends notifications when anomalies are detected
- Uses statistical analysis on trace data
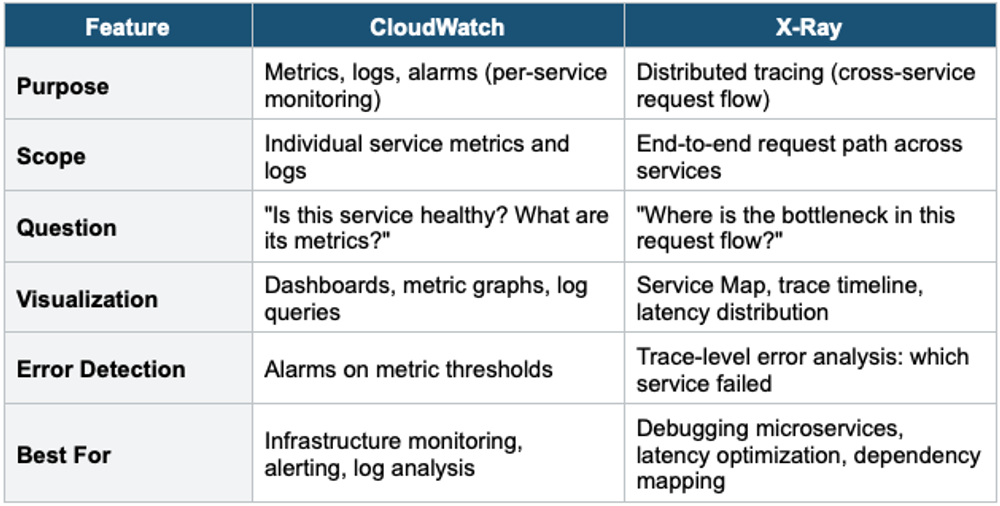
7. X-Ray vs CloudWatch
8. AWS Distro for OpenTelemetry (ADOT)
- AWS-supported distribution of the OpenTelemetry project
- Vendor-neutral alternative to X-Ray SDK
- Collects traces AND metrics from your applications
- Sends to: X-Ray, CloudWatch, Prometheus, Grafana, and third-party tools
- Supports: Java, Python, JavaScript, .NET, Go
- Use ADOT when: you want vendor-neutral instrumentation or need to send telemetry to multiple backends
9. Complete Observability Stack
AWS Observability Stack:

  Metrics:  CloudWatch Metrics   → Dashboards + Alarms
  Logs:     CloudWatch Logs      → Insights + Metric Filters
  Traces:   X-Ray                → Service Map + Trace Analysis
  Events:   EventBridge          → Event routing + automation

  Combined: CloudWatch + X-Ray + EventBridge = full observability

  Alternative: ADOT (OpenTelemetry) → X-Ray + CloudWatch + third-party
Exam Tip X-Ray: "Distributed tracing" = X-Ray. "Service Map" = X-Ray. "Find bottleneck across microservices" = X-Ray. "Where is the latency?" = X-Ray trace. Annotations = indexed (searchable). Metadata = not indexed. Lambda: enable Active Tracing. EC2: install X-Ray Daemon + SDK. ECS: sidecar pattern. Sampling = control cost. ADOT = vendor-neutral alternative. X-Ray ≠ CloudWatch: CW = per-service metrics/logs, X-Ray = cross-service request tracing.